How Policy Hidden in an Algorithm is Threatening Families in This Pennsylvania County


You hear a knock on your door. Expecting a neighbor or perhaps a delivery, you open it, only to find a child welfare worker demanding entry. It doesn’t seem like you can refuse so you let them in and watch as they search every room, rummaging through closets, drawers, cabinets, the fridge — all without a warrant. They ask questions making it sound like you’re a bad parent and, finally, say they need to do a visual inspection of your kids, undressed, without you in the room, and take pictures.
The agency receives many reports of ordinary neglect, which are distinct from physical abuse or severe neglect allegations, but it doesn’t investigate all of them. Instead, the agency had started using an algorithm to help decide who gets the knock on the door and who doesn’t. But you can’t get any information about what it said about you or your child, or how it played a role in the decision to investigate you.
Though an algorithm may sound neutral, predictive tools are designed by people. And the choices people make when creating the tool aren’t just decisions about what statistical method is better or what data is necessary to make its calculations. The same people can be flagged as more or less in need of investigation based on how a tool was designed. One recurring concern is that the use of these tools in systems marked by discriminatory treatment and outcomes will result in those outcomes being replicated. But this time, if that history repeats itself, the disparate results will be deemed unquestionable truths supported by science and math, and not the result of residual or ongoing discrimination, let alone the policy decisions that resulted when tool designers decided to choose model A instead of model B.
To better understand whether this concern is warranted, two years ago, the ACLU requested data and documents from Allegheny County, Pennsylvania related to the Allegheny Family Screening Tool (AFST) so we, together with researchers from the Human Rights Data Analysis Group, could independently evaluate its design and practical impact. We found, among other things, that the AFST could result in inequities in screen-in rates — the percentage of reports (i.e., neglect allegations received by the county child welfare agency) that are forwarded for investigation (“screened in”) out of the total number of reports received. We found that the tool could result in screen-in rate disparities between Black and non-Black families (i.e., the percentage of Black families flagged for investigation out of all allegations about Black families received could be greater than the same percentage for non-Black families). We also found that households where people with disabilities live could be labeled as higher risk than households without a disabled resident. What really stood out though was that we found the AFST’s algorithm, or the way its conclusions about a family were conveyed to a screener, could have been built in different ways that may have had a less discriminatory impact. And this alternative method didn’t change the algorithm’s “accuracy” in any meaningful way, even if we accept the tool’s developer’s definition of that term. We asked the county and tool designers for feedback on a paper describing our analysis, but never received a response. We share our findings for the first time today. But first, a quick overview of how the AFST works.
Allegheny County has been using the AFST to help screening workers decide whether to investigate or dismiss neglect allegations. (The AFST is not used to make screening decisions about physical abuse or severe neglect allegations because state law requires that those be investigated.) The tool calculates a “risk score” from 0 to 20 based on the underlying algorithm’s estimation of the likelihood that the county will, within two years, remove a child from the family involved in the report. In other words, the tool generates a prediction of the “risk” that the agency will place the child in foster care. The county and tool designers treat removal as a sign that the child may be harmed, so that the higher the likelihood of removal, the higher the score, and the greater the presumed need for child welfare intervention. Call-in screeners are instructed to consider the AFST’s output as one factor among many in deciding whether to forward the report for agency action.
However, in a child welfare system already plagued by inequities based on race, gender, income, and disability, using historical data to predict future action by the agency only serves to reinforce those disparities. And when reborn through an algorithm, people are liable to interpret the disparities as hard truths because, well, a mathematical equation told us so.
In this way, the AFST creators are doing more than math when building a tool. They also have the ability to become shadow policymakers — because unless the practical impact of their design decisions is evaluated and made public, this power can be wielded with little transparency or accountability, even though these are two of the reasons why the county adopted the tool.
Here is a summary of the design decisions and resulting policies and value judgments that we shared with the county as cause for concern:
“Risky” by Association
When Allegheny County receives a report alleging child neglect, the AFST generates an individualized “risk score” for every child in the household. However, call screeners don’t see individual-level scores. Instead, the AFST shows an output based on only the highest score of all the children in the household. For referrals where the maximum score falls between 11 and 18, the AFST displays the score’s numeric value. For maximum scores of 18 and up, the AFST displays a “High Risk Protocol” label as long as at least one child in the household is under 17. This subset of referrals is subject to mandatory investigation, which only a supervisor can override. For referrals with a maximum score less than 11 and no children under 7, screening workers see a “Low Risk Protocol” label.
We found that the decision to communicate only the AFST’s predictions of the highest-scoring child could have created inequitable outcomes. We say “could have” because we could not run our analysis on the actual numbers of Black and non-Black families so instead, as is common practice including by the county and its tool developers, we looked at Allegheny County data collected before the AFST was deployed to model what the risk scores would have been.
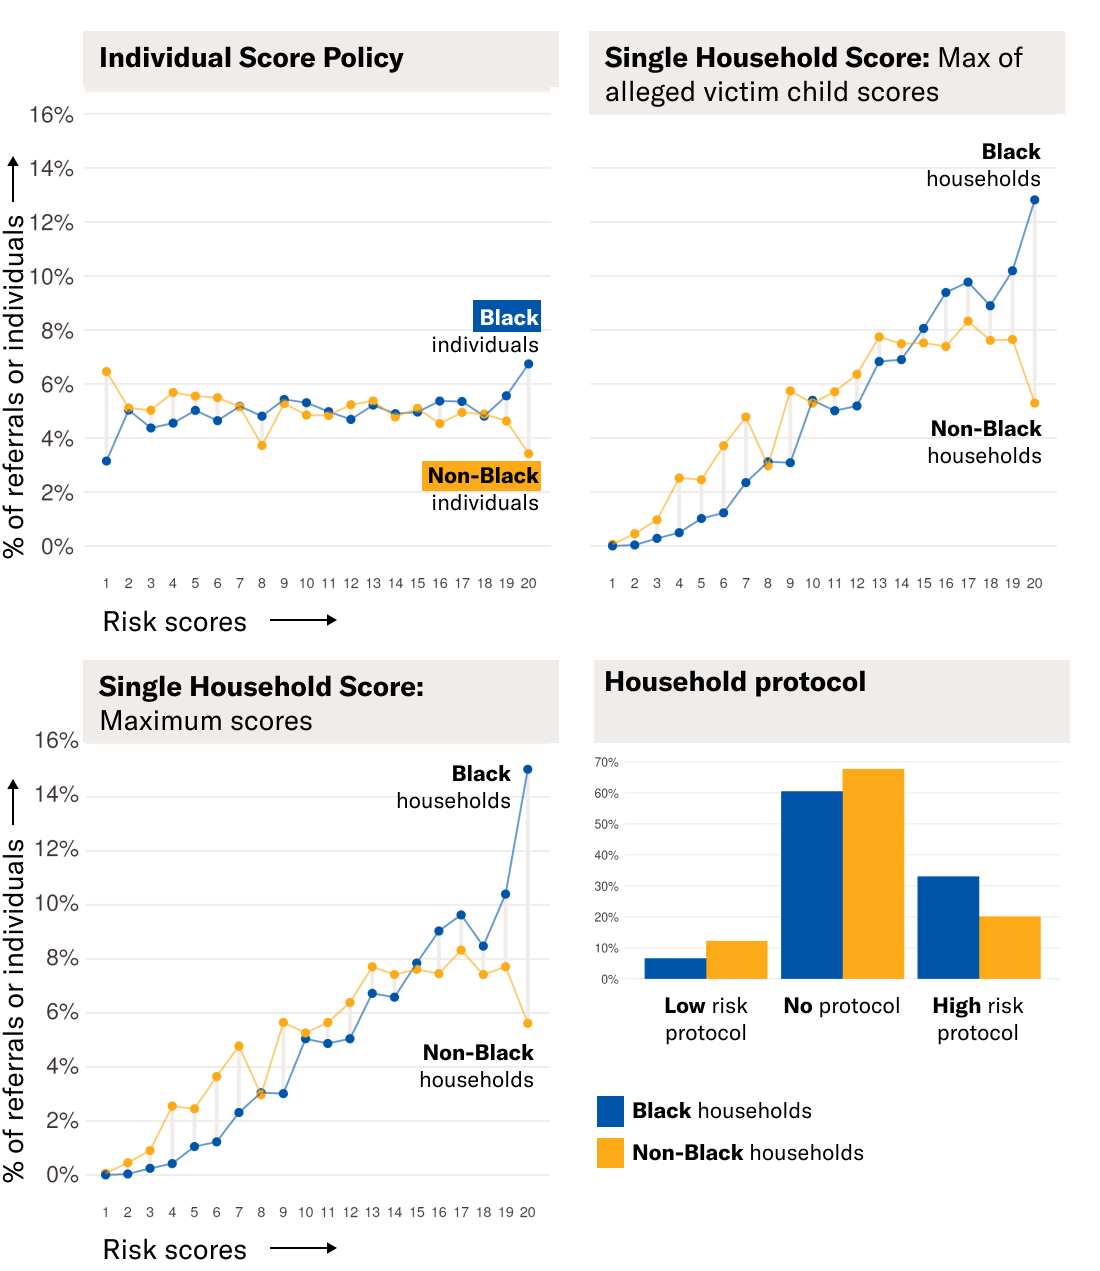
Compared to other ways of conveying the AFST’s scores, the method in use could have resulted in the AFST classifying Black families as having a greater need for agency scrutiny than non-Black families. Through our analysis of data from 2010-2014, we found that the AFST’s method of showing just one score would have resulted in roughly 33% of Black households being labeled “high risk,” thereby triggering the mandatory screen-in protocol, but only 20% of non-Black households would have been so labeled.

Fig. 1. Distribution of AFST Scores by Race Under Different Scoring Policies, using testing data from 2010-2014. Under policies that assign a single score or screening recommendation to the entire household, AFST scores generally increase for all families, and Black households receive the highest scores more often than non-Black households. Under the current “Single Household Score” policy, nearly 35% of Black households are labeled as “high risk” for future separation while only 20% of non-Black households are labeled as “high risk.”
The More Data, the Better?
To build the tool’s algorithm, its designers needed to look at historical records to identify circumstances and individual characteristics most associated with child removals, since the tool bases its risk scores essentially on whether and how those factors are present in the incoming report. Thus to further one of the county’s stated goals in adopting the AFST — to “make decisions [about whether to screen in a report] based on as much information as possible” — the county gave the AFST designers access to government databases beyond the county’s child welfare records, such as juvenile probation and behavioral health records. The problem is that these databases do not reflect a random sample or cross-section of the county’s population. Rather, they reflect the lives of people who have more contact with government agencies than others. As a result, using such a database to identify the characteristics of households more likely to have a child removed means selecting from a pool of factors that over-represents some groups of people and underrepresent others, making it more likely that the tool will classify the same overrepresented populations as higher risk, not because they are more likely to be harmed or to cause harm, but because the government has access to data about them but little or no access to data about others.
Take for instance the county’s juvenile probation database, which was used to construct the AFST. A recent study found that Black girls in the county were 10 times more likely and Black boys were seven times more likely than their white counterparts to end up in the juvenile justice system. As a result, in using the related juvenile probation database to build the tool, the tool developers are mining records that overrepresent Black children as compared to white children.
The behavioral health databases the county used to create the AFST are similarly problematic. Because they expressly include information about people seeking disability-related care, these databases will inevitably contain information about people with disabilities, but not necessarily others. These databases are also skewed along another axis: Because the county doesn’t record information about privately accessed health care, data about individuals with higher incomes is far less likely to be reflected.
Marked Forever
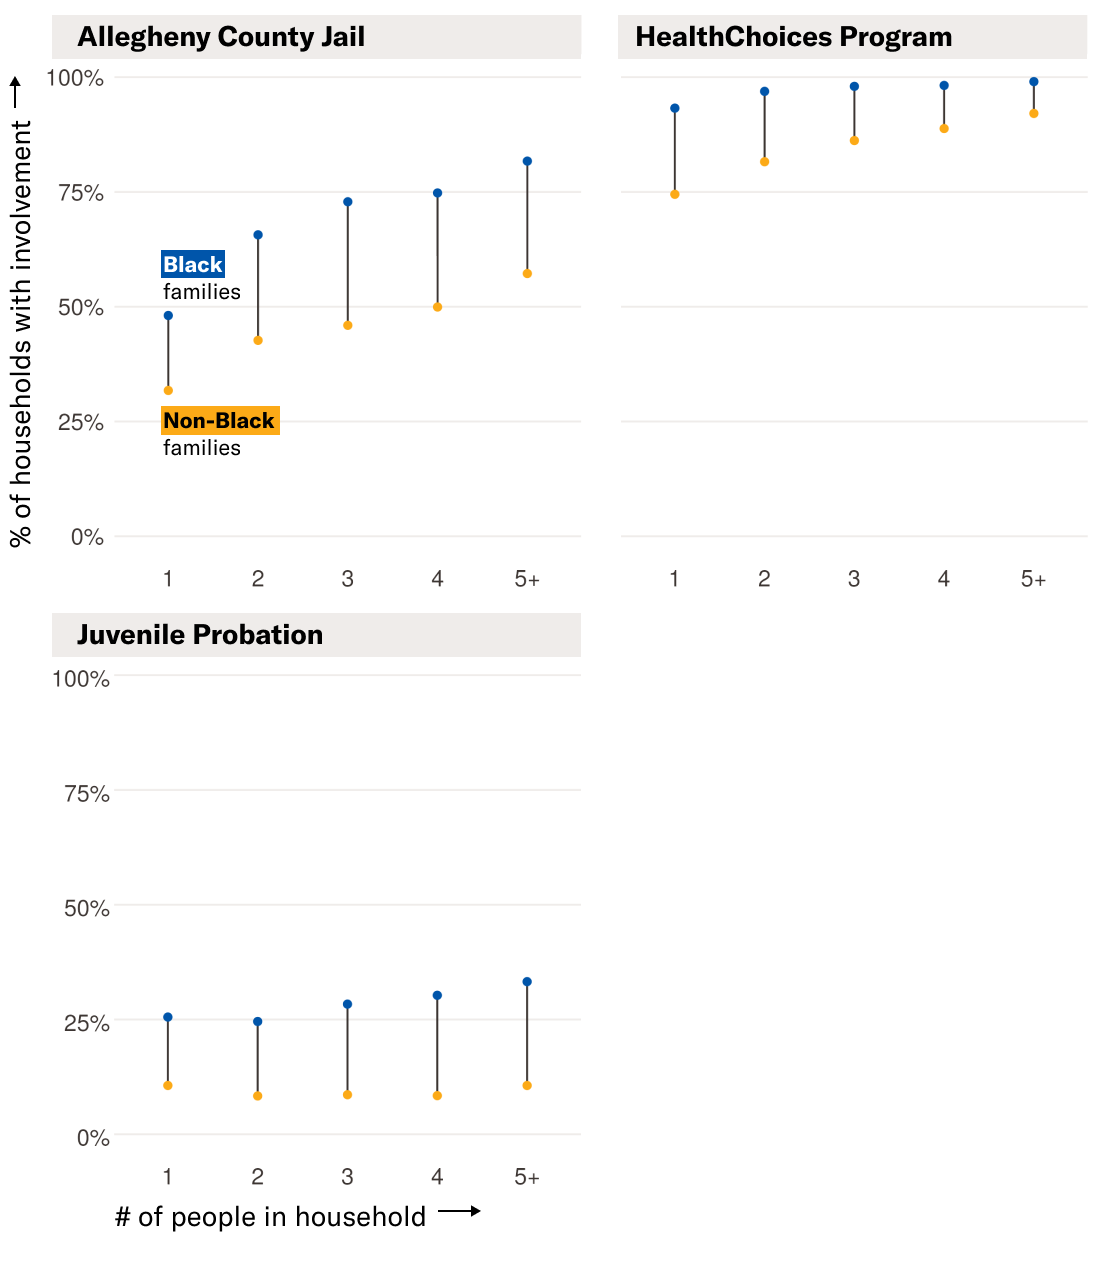
By partly basing the AFST’s removal prediction on factors that families can never change, such as whether someone has been held in the Allegheny County Jail at any time or for any reason, the AFST effectively offers families no way to escape their pasts, compounding the impacts of systemic bias in the criminal legal system. We found that households with more children are more likely to include somebody with a record in the county jail system or with HealthChoices, Allegheny’s managed care program for behavioral health services. We found that by including information that tracks whether someone has ever been associated with these systems, the AFST could have produced greater disparities in Black-white family screen-in rates than an alternate model design that did not take these factors into consideration.

Fig. 3. As household sizes increase, the likelihood that at least one member of the household will have some history with the Allegheny County Jail, the HealthChoices program, or juvenile probation increases as well. Black households are disproportionately likely to have involvement with these systems.
Previous reporting has shown that many families do not even know the county is using the AFST, much less how it functions or how to raise concerns about it. Furthermore, government databases, from public benefits databases to criminal justice databases, are rife with errors. And what happens if the tool itself “glitches,” as has already happened to the AFST?
These challenges demonstrate the urgent need for transparency, independent oversight, and meaningful recourse when algorithms are deployed in high-stakes decision-making contexts like child welfare. Families have no knowledge of the policies embedded in the tools imposed upon them, no ability to know how the tool was used to make life-altering decisions, and are ultimately limited in their ability to fight for their civil liberties, cementing long-standing traditions of how family regulation agencies operate.
Read the full report, The Devil is in the Details: Interrogating Values Embedded in the Allegheny Family Screening Tool below:

The Devil is in the Details: Interrogating Values Embedded in the Allegheny Family Screening Tool
We're examining how algorithmic design choices function as policy decisions through an audit of the Allegheny Family Screening Tool (AFST.)
Source: American Civil Liberties Union

